April 5, 2024
The sound of science: VCU students compose electronic music that incorporates environmental data gathered at VCU Rice Rivers Center
The ear, not just the eye, is a powerful route for experiencing and interpreting data, and a course that unites VCUarts and VCU Life Sciences is finding the harmony in nature.
Share this story
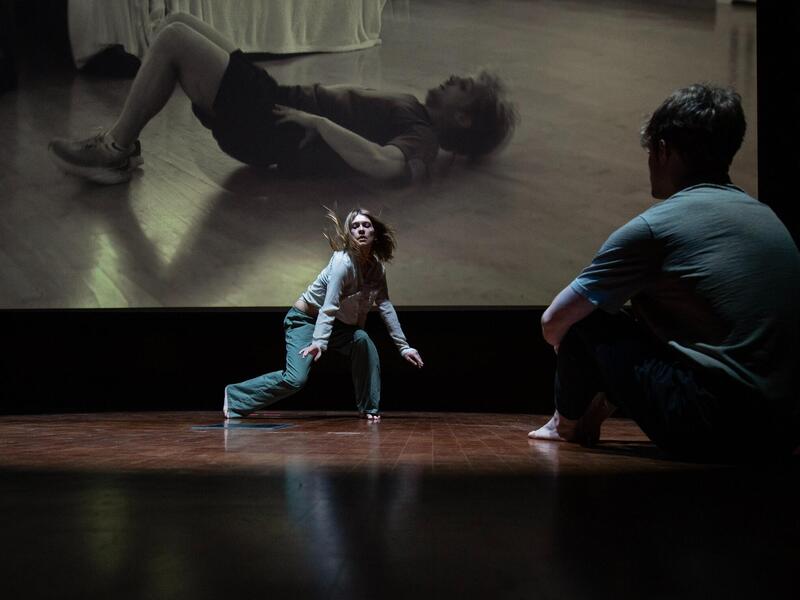
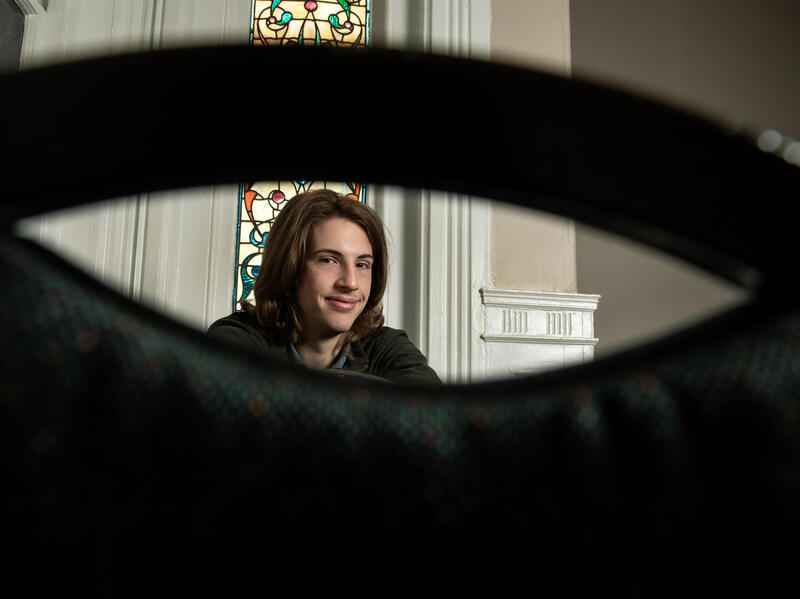
Quayde Stuckey, a junior kinetic imaging major, is performing his electronic music composition, “Marsh in July” in a dark classroom in the Virginia Commonwealth University School of the Arts Depot Annex.
His classmates lounge on blankets and listen intently.
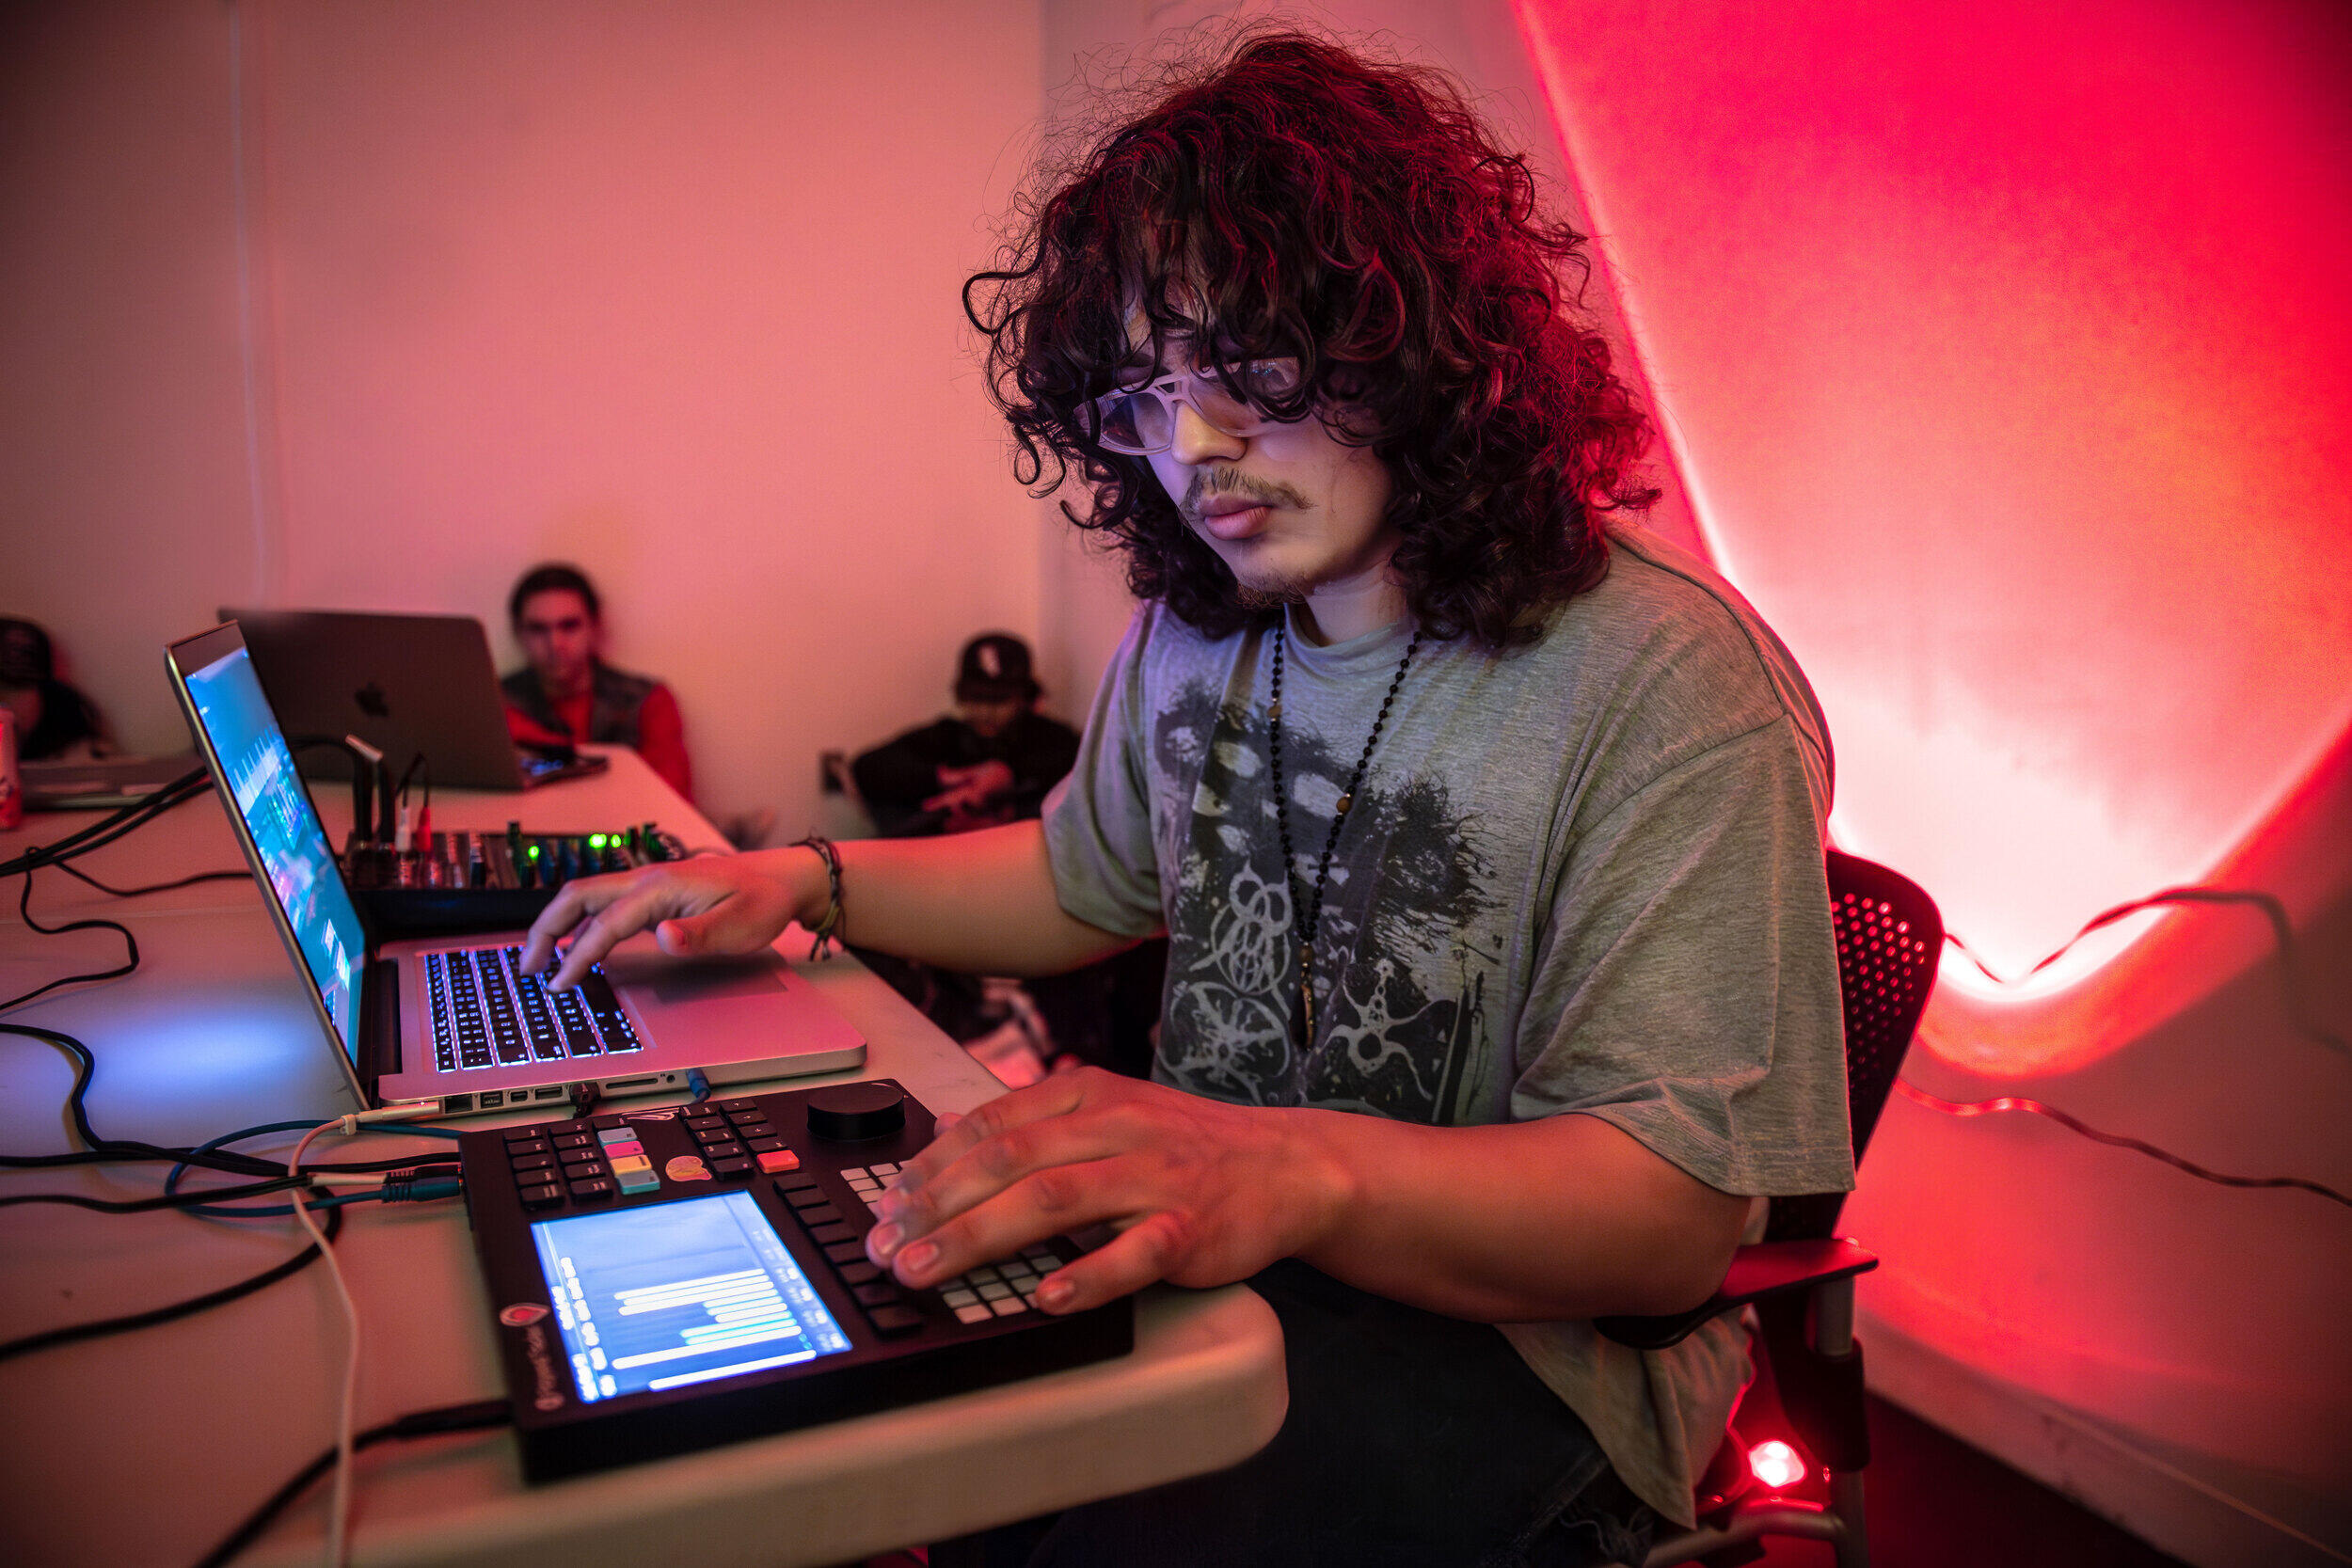
Stuckey was one of six students in VCUarts Department of Kinetic Imaging’s Data Sonification class who performed their music at an “algorave,” a live-coded performance in which they incorporated environmental data gathered at VCU’s Rice Rivers Center and then converted it into sound.
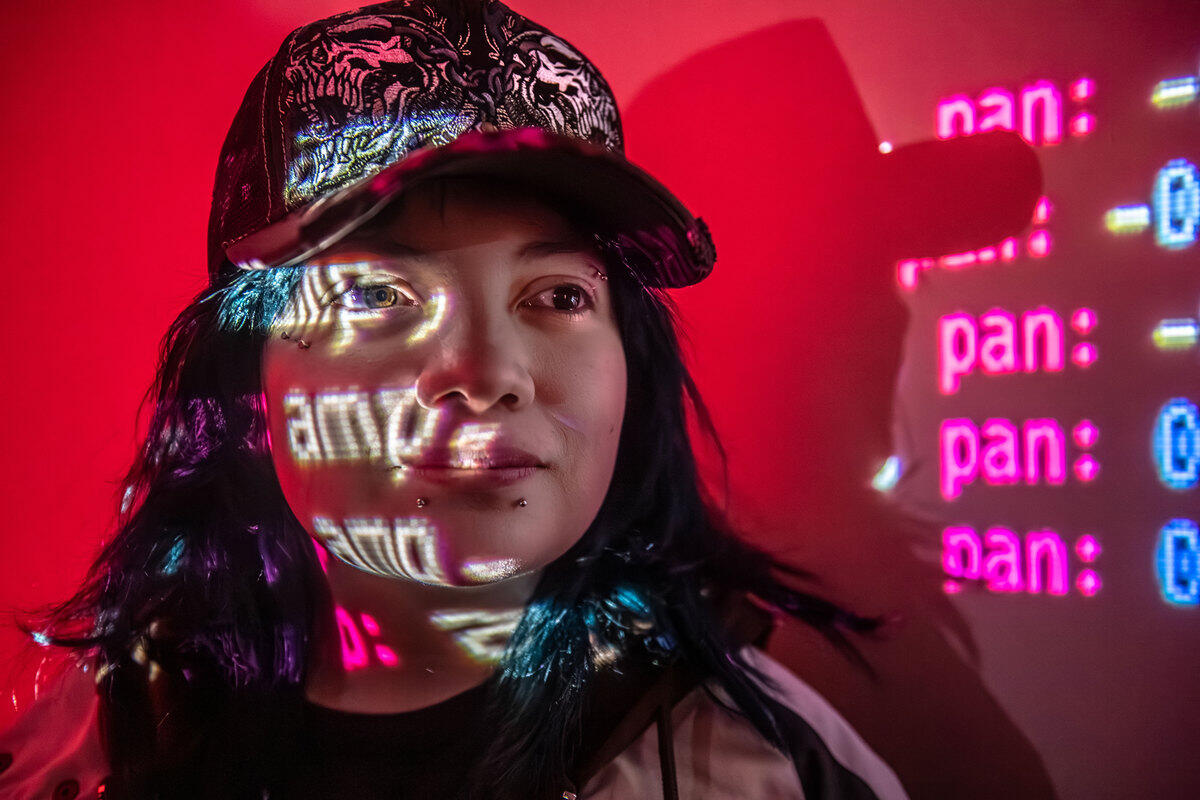
“I used wind speed and wind direction data to make a kind of crazy wind sound, and the direction of the wind is represented by the panning in the speakers,” Stuckey said. “Also, I used humidity data in the distance between the beats. … I thought the process was really cool. We took this data — scientific numbers — and turned it into music.”
Sara Bouchard, a VCUarts instructor, multidisciplinary artist and composer, teaches the class on data sonification, which is the representation of information through sound.
“It could be considered the auditory equivalent of creating a visual chart, but really, it’s more nuanced than that,” Bouchard said. “Sonification can be as simple as a microwave beeping to tell you your food is ready, but the type my class is focused on is called parameter mapping. This means taking a dataset — say, temperatures over time — and scaling those numbers proportionally to fit a new range — say, pitches on a piano. In this example, the max and min temperatures would be the highest and lowest notes on the piano. But you don’t have to use pitch — you can also map your dataset to the amount of an audio effect or the volume level of a sound clip.”
Listening to data, Bouchard said, is different than visualizing it because it unfolds over time and is experiential.
“There are obvious benefits to looking at a graph and immediately being able to take in larger trends such as the max and min values. But our ears are better attuned to certain patterns, and some scientists are actually choosing to listen to data to help them in their research — astronomers, for example,” she said. “From a communications perspective, a data presentation that is experiential (and potentially musical) is more likely to stick in the listener’s memory and spark an emotional response.”
Data sonification is a developing field that can involve many disciplines, including music, information design, journalism, psychology, math, science and fine art.
“We’re constantly having discussions about not just aesthetics but also big-picture concepts: Why should we listen to data, and how does this fit into a creative practice?” Bouchard said.
Art and science
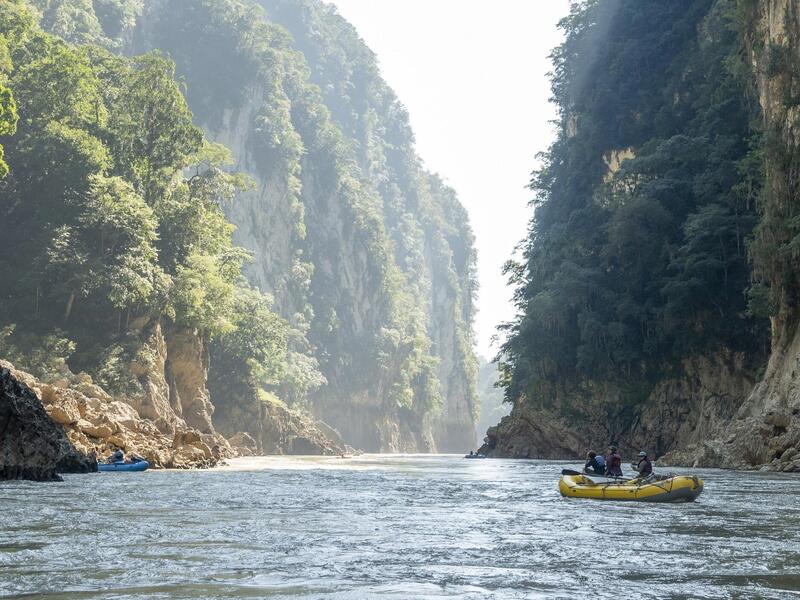
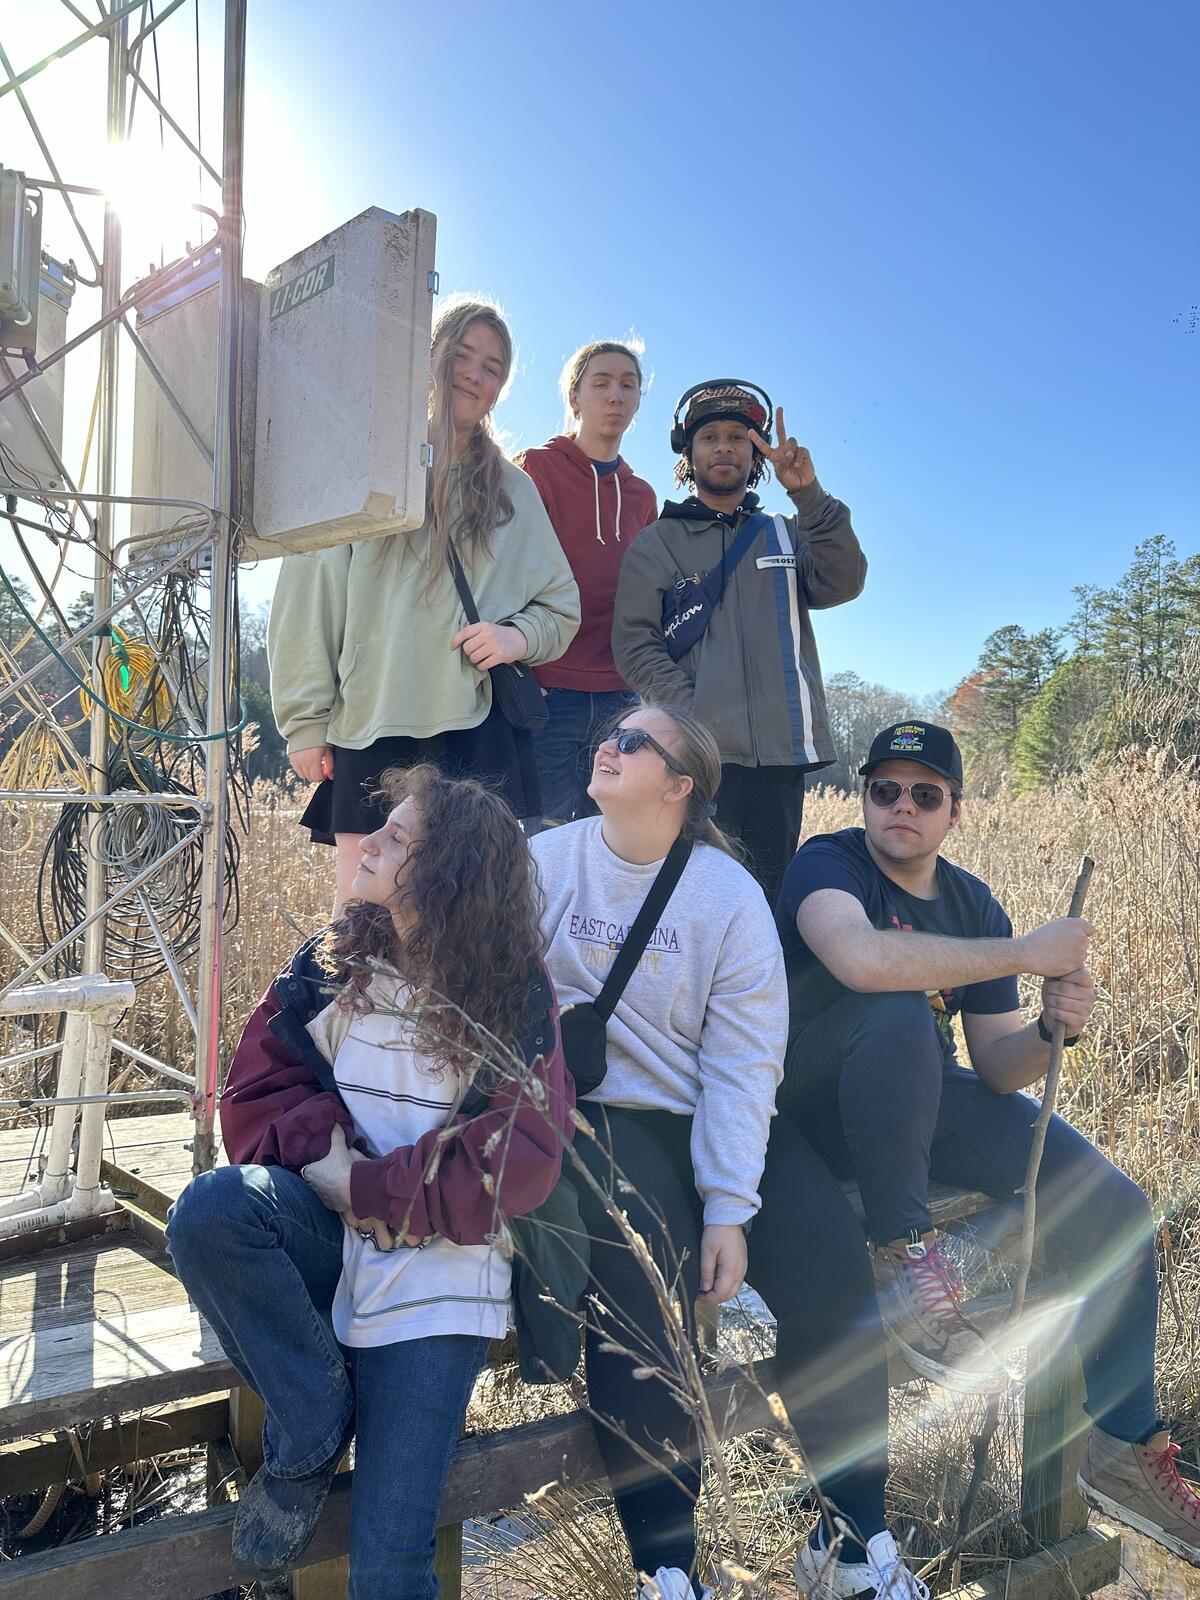
Bouchard’s class recently visited the Rice Rivers Center, which is part of VCU Life Sciences, to check out a meteorological “carbon flux” tower, US-RRC: Rice Rivers Center Marsh. Uniquely located in a restored wetland, the tower collects data on greenhouse gasses such as methane and carbon, as well as air and soil temperatures, humidity, incoming solar radiation and more.
Christopher Gough, Ph.D., an associate professor in the Department of Biology in the College of Humanities and Sciences, leads the flux tower research. Gough — who is a trained singer and musician himself and whose lab has a history of combining art and science — explained that the tower was ideal for this collaboration because it collects high-frequency environmental data.
“The data patterns vary over time and, depending on the frequency and source of observations, provide a rich and variable dataset for sonification,” he said. “An additional benefit is the accessibility of the Rice Rivers Center flux tower, allowing art students to visit the site. It’s not your typical crowd of visitors to the flux tower.”
Gough added that the partnership underscores how complex problems in science require creative thinking.
“I think scientists have much to learn from the arts community and their out-of-the-box creative approaches to interpreting the natural world. Making science relevant, interesting and accessible to all requires multiple forms of science communication,” he said. “For audiophiles like me, listening to data is a very cool alternative to conventional visualizations like line charts and scatter plots. And it’s likely a more exciting and accessible form of data translation for many nonscientists, which is crucial if scientists hope to make our research useful, appreciated and relevant to all.”
Bouchard agreed, noting that “artists and scientists are working toward common goals as we observe, explore and uncover deeper truths about our world.”
“What brought me personally to science is a deep connection to the landscape and my concerns about climate change,” she said. “As an artist who collaborates with the environment, I try to be mindful of as many perspectives as possible — scientific, historical, Indigenous, sociopolitical, faunal, floral, geological — in order to make a greater impact with my work.
“I am very concerned about what our climate future holds for my 4-year-old son and for communities already suffering around the globe,” Bouchard continued. “In order to combat a feeling of helplessness, I encourage people to engage with their environment on a local level. It is my belief that making connections with one’s immediate landscape — listening to it, taking care of it and sharing it with others — is the first step in building communities that can advocate for a global realignment of values.”
Connecting to the data
Bouchard and Gough met several years ago while Bouchard was an MFA student at VCUarts in the Department of Kinetic Imaging and interested in collaborating with ecologists and using data from the Rice Rivers Center.
“Chris was extremely generous,” she said. “I drove out to RRC a few times; he showed me the flux tower then and let me sit in on one of his classes. Though at that time I ended up pursuing a project with a water ecologist (“Breathe, River”), I kept Chris in mind as someone I should keep in touch with.”
Last summer, Bouchard was conducting site research for an exhibition at The Anderson, the VCUarts on-campus gallery – she had just been awarded the 2023 Excellence in Adjunct Research Award and Exhibition, and she was interested in working with sensors on trees. She consulted with Gough, who brought his lab assistants to her exhibition (“Forest for the Trees”) for an interdisciplinary discussion. When Bouchard began developing the Data Sonification course, she reached out to Gough, who offered to give a presentation and host the students at the Rice Rivers Center.
When they visited the site this spring, a few students were a bit skeptical as they walked through the mud, Bouchard said, but afterward said they got a lot out of the field trip.
“Chris led my students through the woods to the flux tower, which stands on a platform above the wetlands,” she said. “He explained what all the different instruments were, how they are used and answered a ton of questions. He’s a great teacher and is clearly passionate about his work. I was really happy we were able to make the trip because I wanted the students to experience a physical connection between the data they’re using — which is just incredibly long strings of numbers in a spreadsheet — and the actual place from which it originates.”
Siena Allen, a fourth-year kinetic imaging major in the class and who performed at the algorave, said visiting the flux tower provided perspective that informed the art.
“There’s so much to feel in that river environment, and those feelings are an important result of our data analysis just as the hard numbers are,” Allen said. “The live performance aspect was an exciting challenge, and the novelty of this medium allowed for an open space, accepting of whatever unexpected turns our data took during its live translation.”
Bouchard first began exploring data sonification after experiencing dramatic temperature shifts in New York City a decade ago.
“I remember feeling a bit alarmed by this evidence of climate change and wondering what the ‘melody line’ of the temperature graph would sound like. This became my piece ‘Weather Box,’” Bouchard said. “Since then, I’ve used data off and on in my work as one method of ‘lifting song’ from my environment. I think translating data to sound can be fun — like figuring out a puzzle — but it’s important to see the big picture, too. For me, that means taking the time to unplug, go on walks by the river and really be in the landscape — not just reducing the environment to a set of numbers.”
Learning new tools
Students in Bouchard’s Data Sonification class are learning to use the same tools, such as the live coding software Sonic Pi, sensor-equipped microcontrollers and more, that she uses in her art.
Their first assignment was to hand-collect data about their everyday lives, craft a visualization of the data and then create a corresponding audio piece sonifying the data.
In the second assignment, working with the Rice Rivers Center data, the students learned how to code electronic music and how to use code to read and interpret data directly from spreadsheets. Part of the goal of this project was also to consider how many different “stories” can be told within the same dataset, with the focus shifting based on the chosen time scale (hourly, daily), selected variables (such as temperature or carbon exchange) and the creative choices of the artist. Students were able to choose between performing their work in the class algorave or presenting their work in a traditional critique.
The students’ third assignment will be to use Sonic Pi to “listen to” and interpret real-time sensor data (such as motion or light) streaming from a microcontroller.
Max Biscarr, a sophomore kinetic imaging major in the class, said the experience of creating art in collaboration with environmental data has been fascinating. Biscarr used sequences of air temperature data and soil temperature data, along with an ambient base, to create music he described as a “deep listening meditation that exists somewhere in an environment.”
“It was interesting to use data directly related to the natural world and cycles of nature,” Biscarr said. “Nature is unpredictable and random at times, so it was a matter of balancing the dissonance that you get from the data with the harmonics you want to portray in the music.”
Allen added that data sonification allows artists and audiences to explore the ways in which data and sound can interact and convey information.
“It’s so important to represent data in diverse ways,” Allen said, “and translating it into an audio experience lets people really feel and internalize the science.”
Subscribe to VCU News
Subscribe to VCU News at newsletter.vcu.edu and receive a selection of stories, videos, photos, news clips and event listings in your inbox.